快速了解
它能做什么
在 DeepSeek Harness Web 中显示供应商余额、配额和外部模型健康数据。
本站提供的是中文说明,不代表该项目或 Plugin 自身提供中文界面;语言支持请以上游文档为准。
Web Profile
DSH 0.1.5-rc.1 or newer; @deepseek-ai/dsh-settings ^0.1.5-rc.2
证据已验证
核对日期 2026/9/15 UTC 14:11
选择前先看
DSH 余额与配额为 DSH Web 增加“供应商状态”设置页,并在聊天输入框下方显示状态栏。可配置内置或自定义余额供应商,也可接入公开 JSON 监控接口,以展示模型状态、可用性、首 Token 时间、响应时间、历史记录和自定义指标。
适合谁
需要管理一个或多个模型供应商,并希望查看账户余额、配额及外部模型状态的 DeepSeek Harness Web 用户。
常见任务
- 在聊天输入框下方显示供应商余额、滚动配额、周配额或月配额。
- 按会话切换当前供应商,并手动刷新余额数据。
- 将公开 JSON 监控接口映射为模型健康状态、可用性、延迟和历史记录。
- 设置模型目录信息,例如上下文窗口、图像输入能力和推理等级。
权限与数据
该插件会读取已配置供应商的余额接口和公开监控 JSON 接口,并在 DSH Web 中展示结果。
权限- 访问用户配置的公开 HTTP(S) JSON 端点。
- 当供应商需要 API 密钥时,使用 DSH 凭据引用。
- 会获取余额、配额、状态和监控 JSON 用于展示与缓存。
- 文档说明 API 密钥保留在 DSH 凭据中,不会进入浏览器配置。
- 健康监测预览按监控项缓存;余额数据使用共享 Host 缓存。
- 已配置的供应商余额 API。
- 已配置的第三方模型健康监测 JSON API。
- 可选:需要 API 密钥的供应商通过 DSH 凭据引用进行配置。
局限
- 需要 Node.js 22+ 和兼容的 DSH Web 安装。
- 提供的证据验证了 bundle 结构和 Git 分发,未验证真实环境中的安装或运行。
- 健康数据反映的是已配置的第三方监控,不代表当前账户本身。
- 监控端点必须是公开 HTTP(S);文档说明不支持 Cookie 或需要认证的监控端点。
- 捕获到的包版本未在 npm 注册表中找到。
DSHub 已核对
- 已验证固定源码提交和 Git bundle 分发。
- 公开包清单将 `dsh-balance-quota` 0.3.7 标识为 DSH Web 插件。
- Bundle patch 会挂载 `dsh-balance-quota`。
- 已提供 MIT 许可证文本。
DSHub 未核对
- 未在真实 DSH 环境中执行安装。
- 未测试已配置端点、凭据解析、显示数值或刷新行为。
- 未验证捕获包版本在注册表中的可用性。
固定版本安装
安装 DSH Balance & Quota
这个Plugin Bundle没有 DSH Plugin 安装操作,请根据源码文档使用真实交付方式。
维护者原文
项目 README
dsh-balance-quota
Balance, quota, and model-health monitoring for DeepSeek Harness Web



English · 简体中文
</div>dsh-balance-quota displays provider balance or quota below the DSH chat composer. It can also consume third-party JSON status APIs and show model health, availability, TTFT, response time, history, and custom metrics.
Current development version: 0.3.5 · Previous npm release: 0.3.3
DSH compatibility: 0.3.4 requires DSH 0.1.5-rc.1 or newer (
@deepseek-ai/dsh-settings≥0.1.5-rc.2), which removed thesettingsNamespace()helper in favour of passing the namespace string straight tosettings.register(). Use 0.3.3 on DSH 0.1.4 and older.
Complete feature map
| Area | Features |
|---|---|
| Official presets | DeepSeek balance and OpenCode Go rolling/weekly/monthly quota |
| Custom balance | Public HTTPS, GET/bodyless POST, custom headers, timeout, refresh interval |
| JSON extraction | Property paths, array indexes, optional chaining, up to five ?? fallbacks |
| Amount handling | Static/dynamic currency, amount divisor, unsaved-draft testing |
| Status bar | Balance, update time, force refresh, and health entry below the composer |
| Provider selection | Default provider, inline switching, per-conversation memory |
| Model settings | Model catalog, context window, text/image input, reasoning levels |
| Health monitoring | External JSON API, status, availability, TTFT, response time, history |
| Visual binding | Select a preview slot, then select a JSON field; preview updates immediately |
| All-model preview | Preview up to 50 models with current mappings without another request |
| Transforms | Text, number, percentage, status, status-value maps, percentage multipliers |
| Number formatting | Per-field input unit, display unit, and 0–2 decimal places |
| Custom fields | Error rate, empty response, common errors, or any model metric |
| Cache and refresh | Shared Host balance cache, health-preview cache, pause while hidden |
| Credential security | Reuses DSH credential refs; API keys never enter browser configuration |
| Network security | Public HTTPS, DNS pinning, rebinding protection, private-IP/redirect blocking |
Installation
Requires Node.js 22+ and the DSH CLI.
dsh plugin --profile web add dsh-balance-quota
dsh web
Restart dsh web after installation or upgrade. Verify installation with:
dsh plugin --profile web list
Complete walkthrough
All seven screenshots come from the current plugin running in DSH Web. Provider names, URLs, balances, and model names were replaced with demo values; the UI layout and controls were not redrawn.
1. Where to configure balance
Open Settings → Plugins → Plugin configuration → 供应商状态 (Provider Status).
This page controls balance queries, provider editing, Advanced Settings, the default provider, the chat status bar, and manual refresh.
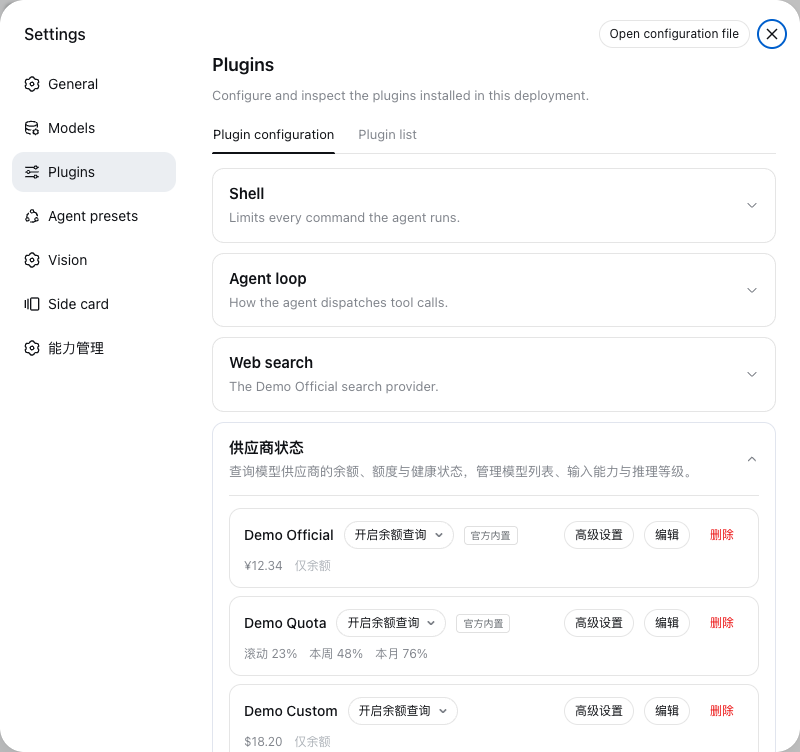
- DeepSeek and OpenCode Go can use built-in official presets.
- Click 编辑 (Edit) for a custom balance API.
- 高级设置 (Advanced Settings) contains Model Settings and Health Monitoring.
- The default-provider option controls new conversations.
- The status-bar option controls the strip below the chat composer.
2. Edit a balance provider
Click 编辑 (Edit) on a provider row:
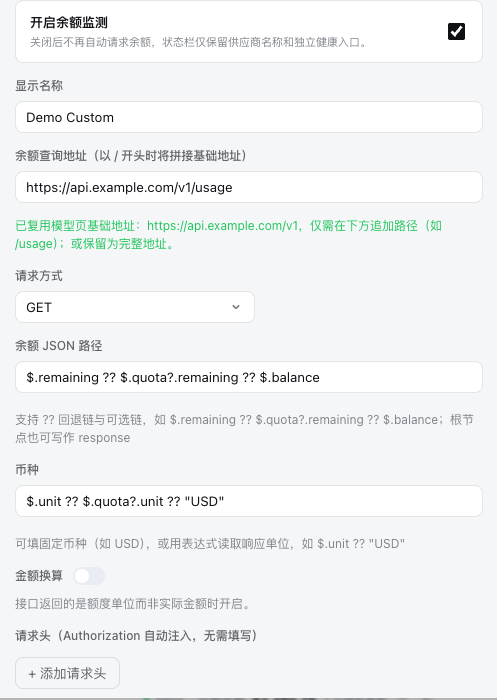
Configure the display name, endpoint, GET/bodyless POST, balance JSON path, static or dynamic currency, amount conversion, headers, refresh interval, and timeout.
Balance: $.remaining ?? $.quota?.remaining ?? $.balance
Currency: $.unit ?? $.quota?.unit ?? "USD"
测试 (Test) validates only the current unsaved draft. It does not write formal configuration, credentials, or production cache. Save after the result is correct.
3. Advanced Settings tab 1: Model Settings
Click 高级设置 (Advanced Settings). The first tab is 模型设置 (Model Settings):
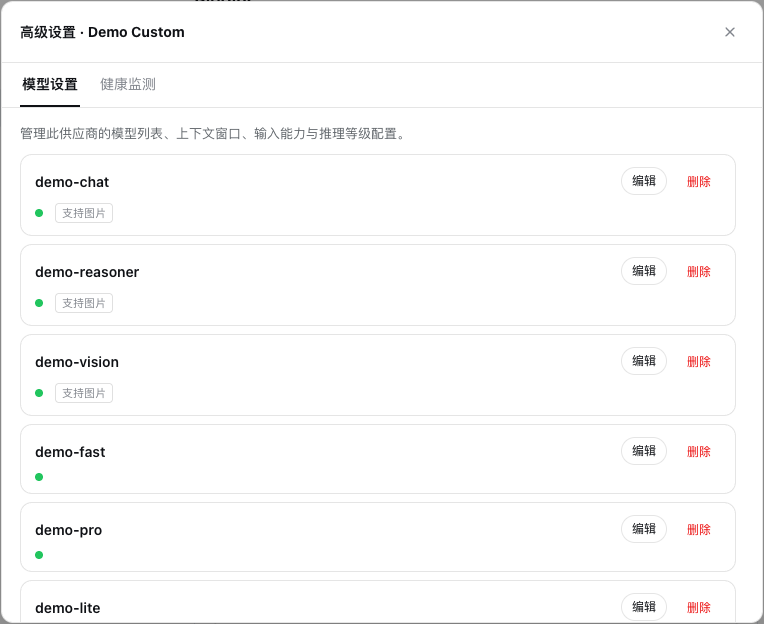
It manages the provider's model ID/display name, context window, text/image input capabilities, and default/available reasoning levels.
This is separate from balance and health: Edit owns balance settings; the second Advanced Settings tab owns external monitoring.
4. Advanced Settings tab 2: Health Monitoring
Switch to 健康监测 (Health Monitoring):
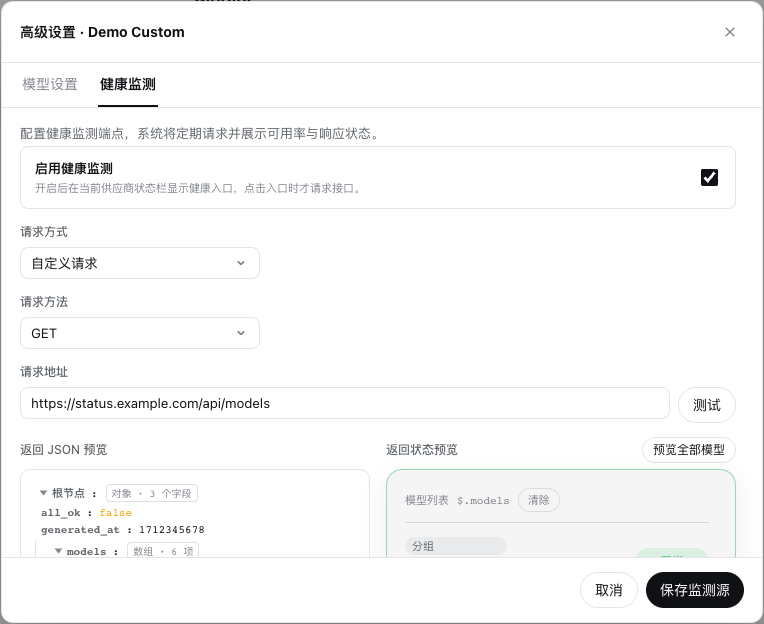
Setup flow:
- Enable health monitoring.
- Select a custom request.
- Enter a public HTTP or HTTPS GET JSON endpoint.
- Click 测试 (Test).
- Inspect the full JSON tree on the left.
- Bind fields and preview status on the right.
- Use 预览全部模型 (Preview all models) to validate every mapping.
- Save the monitor.
Health monitoring reads third-party monitoring data. It does not invoke chat models or consume model quota.
Field binding
Bind the model list first: select the Model List slot on the right, then select an array such as $.models on the left.
| Field | Example path | Purpose |
|---|---|---|
| Model name | $.model |
Card title |
| Group | $.group |
Group badge |
| Status | $.status |
Healthy, failed, warning, unknown |
| Availability | $.availability |
Current availability |
| TTFT | $.ttft_ms |
Time to first token |
| Response time | $.latency_ms |
Request duration |
| History array | $.history |
Recent records |
| History status | $.state |
Per-record state |
| History time | $.time |
Per-record timestamp |
| History error | $.message |
Per-record error |
Transforms, status maps, and numeric formatting
- Text displays the original value.
- Number converts numeric values and applies units and precision.
- Percentage supports automatic scaling, forced ×100, or raw value plus
%. - Status converts values into healthy, failed, warning, or unknown.
Custom status values can use 值映射 (Value mapping):
healthy → healthy
warning → warning
offline → failed
Selecting Number for a custom field reveals three settings:
| Setting | Values |
|---|---|
| Input unit | ms, s |
| Display unit | follow input, ms, s |
| Decimal places | 0, 1, 2 |
For example, 1250ms displayed as seconds with two decimals becomes 1.25s. Settings are stored independently per field.
5. Where the status bar appears
Enable 状态栏 (Status bar) at the bottom of Provider Status, then return to any conversation. It appears directly below the chat composer:

From left to right: health dot, current provider, balance/quota, update time, force refresh, and the health-monitor icon.
6. Switch providers
Click the provider name in the status bar:
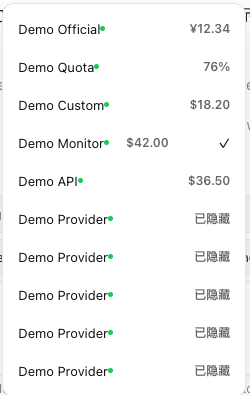
- The active provider has a check mark.
- Selection is remembered independently per conversation.
- New conversations use the configured default provider.
↻bypasses cache and refreshes the current balance immediately.
7. View health after enabling monitoring
After health monitoring is enabled and saved for the current provider, an ECG icon appears next to refresh. Click it to request the endpoint and open details:
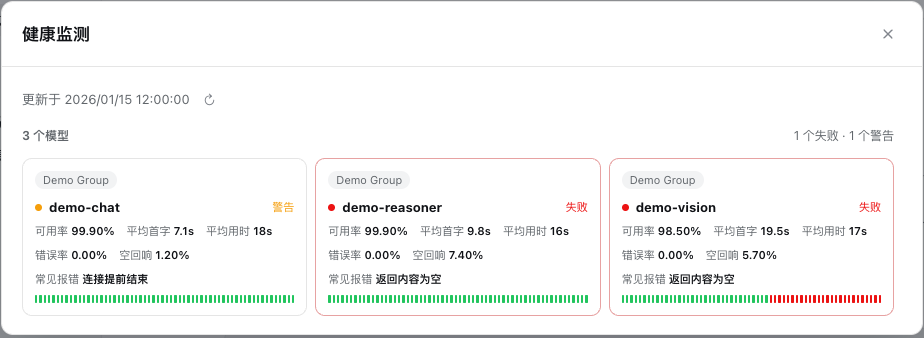
The dialog shows model/failure/warning counts, group and status, availability, average TTFT and response time, custom metrics, recent-history bars, and manual refresh.
Health represents the third-party monitor, not the current account itself.
Refresh and caching
- Each balance provider has its own refresh interval; default is 30 minutes.
- Automatic refresh pauses while the page is hidden.
- Multiple conversations share Host balance cache.
- Manual refresh bypasses cache.
- Health JSON previews are cached per monitor.
- Deleting a monitor deletes its preview cache.
FAQ
The status bar is missing
Configure at least one provider, enable Status Bar at the bottom of Provider Status, and restart dsh web after installation or upgrade.
The health icon is missing
Enable, test, and save Health Monitoring under Advanced Settings. The icon only appears when the current provider has an enabled health monitor.
Saving reports invalid external custom field
Bind the model list first, then select a field inside a model item. Name and path must be non-empty; $.last_errors[0] is valid. Version 0.3.3 trims whitespace and ignores unfinished blank fields.
A query fails
Confirm the endpoint is public HTTP(S) without redirects, the credential ref resolves, and JSON paths match the response. Private, loopback, and internal destinations are rejected.
Security boundary
- API keys are managed by DSH
credentialsand never enter browser configuration. - Only public HTTP/HTTPS is allowed (set
DSH_BALANCE_ALLOW_HTTP=0to require TLS). - Resolved public IPs are pinned to reduce DNS-rebinding risk.
- Private/loopback addresses, redirects, dangerous headers, and oversized responses are rejected.
- JSON paths reject
__proto__,constructor, andprototype. - Health monitoring does not execute page scripts, discover hidden browser APIs, or support Cookie/authenticated monitor endpoints.
See SECURITY.md.
Development and verification
packages/dsh-balance is the only public package.
pnpm install
pnpm dev:install
pnpm check
pnpm test
pnpm pack:check
pnpm verify
Project layout
packages/dsh-balance/
├── lib/host/       # Secure queries, validation, cache, config, health normalization
├── lib/client/     # DSH Web status bar and settings UI
├── docs/images/    # Real redacted README screenshots
├── test/           # Unit and security tests
├── README.md       # npm package guide
└── SECURITY.md     # Security boundary
License
有意识地管理
安装与管理
前置条件与目标 Profile
目标: Web Profile
交付方式: Git Bundle — kongshan-zhuyu/dsh-balance-quota#61bc365a0d5ea5f6d24e226daeb9af8ef3750f62。
验证、更新与移除
显示生命周期命令
dsh plugin --profile web list兼容性与访问范围
DSH Web plugin; requires Node.js 22+: DSH 0.1.5-rc.1 or newer; @deepseek-ai/dsh-settings ^0.1.5-rc.2。
风险事实
Can query configured public balance and health-monitoring JSON endpoints.
证据 ↗Uses DSH credential references for API keys; credentials are not entered in browser configuration.
证据 ↗Documentation states that private or loopback destinations, redirects, dangerous headers, and oversized responses are rejected.
证据 ↗证据与编辑审查Manifest、Bundle patch、分发与新鲜度
不可变证据
审查状态与源码活动
当注册表安装不可用时,请使用固定的 Git bundle 源码。由于插件可获取你配置的端点数据,请先审查这些端点和凭据。
AI 审查于 2026/9/15 UTC 14:12。GitHub 事实核对日期: 2026/9/15 UTC 14:12。
自当前证据基线以来,没有记录到重要源码变化。